|
|
 is a compilation of components for generating Cartesian X/Y-plots from scientific and financial data. It is available as VCL component package for Borland and CodeGear Delphi and C++ compilers and as .net Assembly for the Winforms framework of Microsoft® Visual Studio®. is a compilation of components for generating Cartesian X/Y-plots from scientific and financial data. It is available as VCL component package for Borland and CodeGear Delphi and C++ compilers and as .net Assembly for the Winforms framework of Microsoft® Visual Studio®.
It supports a large variety of axis scaling types, series, calculated line legends, movable markers, etc., and thus gives you a tool for generating scientific and financial graphing programs easily, while retaining numerous options for tailoring the end product to the requirements of you and your customers.
|
-
Plots as easy as creating arrays
-
Fully working program within a few minutes see example(with CodeGear VCL)
-
From online data acquisition graphing to stock charting applications
-
Unlimited number of secondary axis
-
Lines, point symbols, error indicators, arrows, bars, bubbles, OHLC (western plot), candle stick
-
Linear and non linear regression, interpolation, differential, integral
-
Auto updating, auto scaling, auto zooming
-
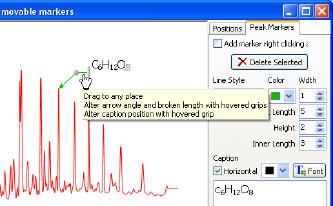
Legends, movable markers, automatic calculation results in labels
-
Editors with enhanced options, color and style selectors with unique PropertyLinks
-
Set properties without writing a line of code (VCL Version only)
|
|

Pie Chart
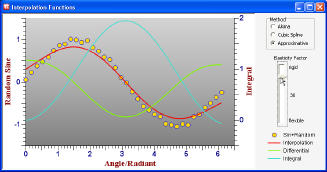
Point Symbols, Interpolation, Differential, Integral, Legend, secondary Axis

Bars with captions

Candle Sticks, Date&Time Scaling
Moving Average

Transparency supported (Alpa RGB Colors)
|

Gas Chromatography Example
Seconds Scaling for Time

Origin at (0, 0), Axes with arrow ends
|